Study Effectively: Concept Mapping
The concept map allows you to take diverse pieces of information into a conceptual whole. By putting the individual pieces of information into a visual which makes sense to you, the concept map also helps you develop the linkages necessary to remember. The process of mapping material you are trying to learn helps you to better understand the material and your finished product helps you to learn and retain the material by concentrating on connections and relationships which build upon one another.
Regardless of your preferred learning strategies, concept mapping can be a helpful tool. However, for the person with a right brain preference for non-verbal, concrete and spatial information, the concept mapping process can be very beneficial.
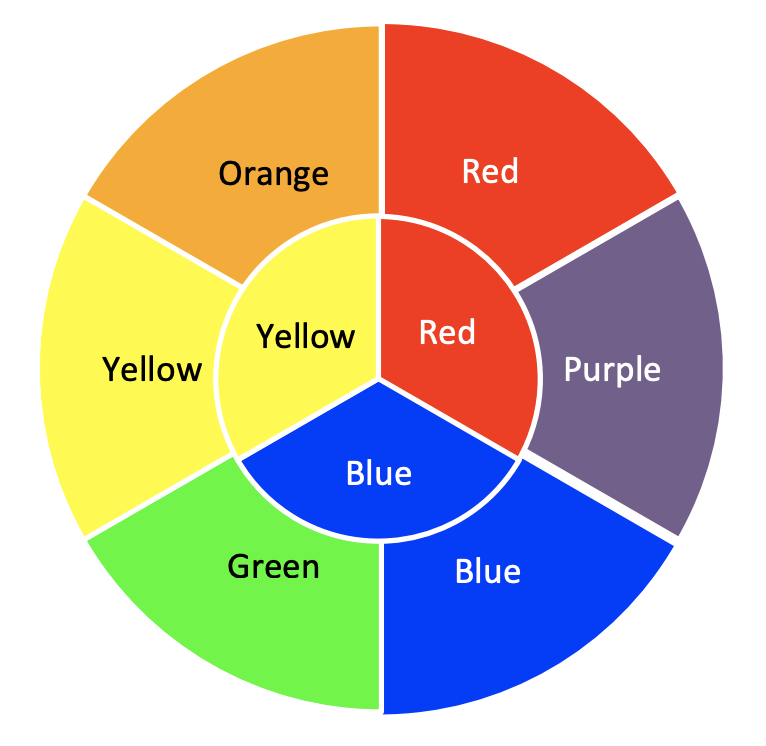
Concept maps can be as simple as the color wheel above or more the more complex map showing how the mixture of the three primary pigments (interior pie chart) create the six secondary colors. This could be expanded to a third level showing the 12 tertiary colors of the color spectrum.
Concept maps come in all shapes and sizes and can be designed to meet your special and unique class and study needs. The following are a few examples of concept maps and how they can be used to improve your learning and retention.
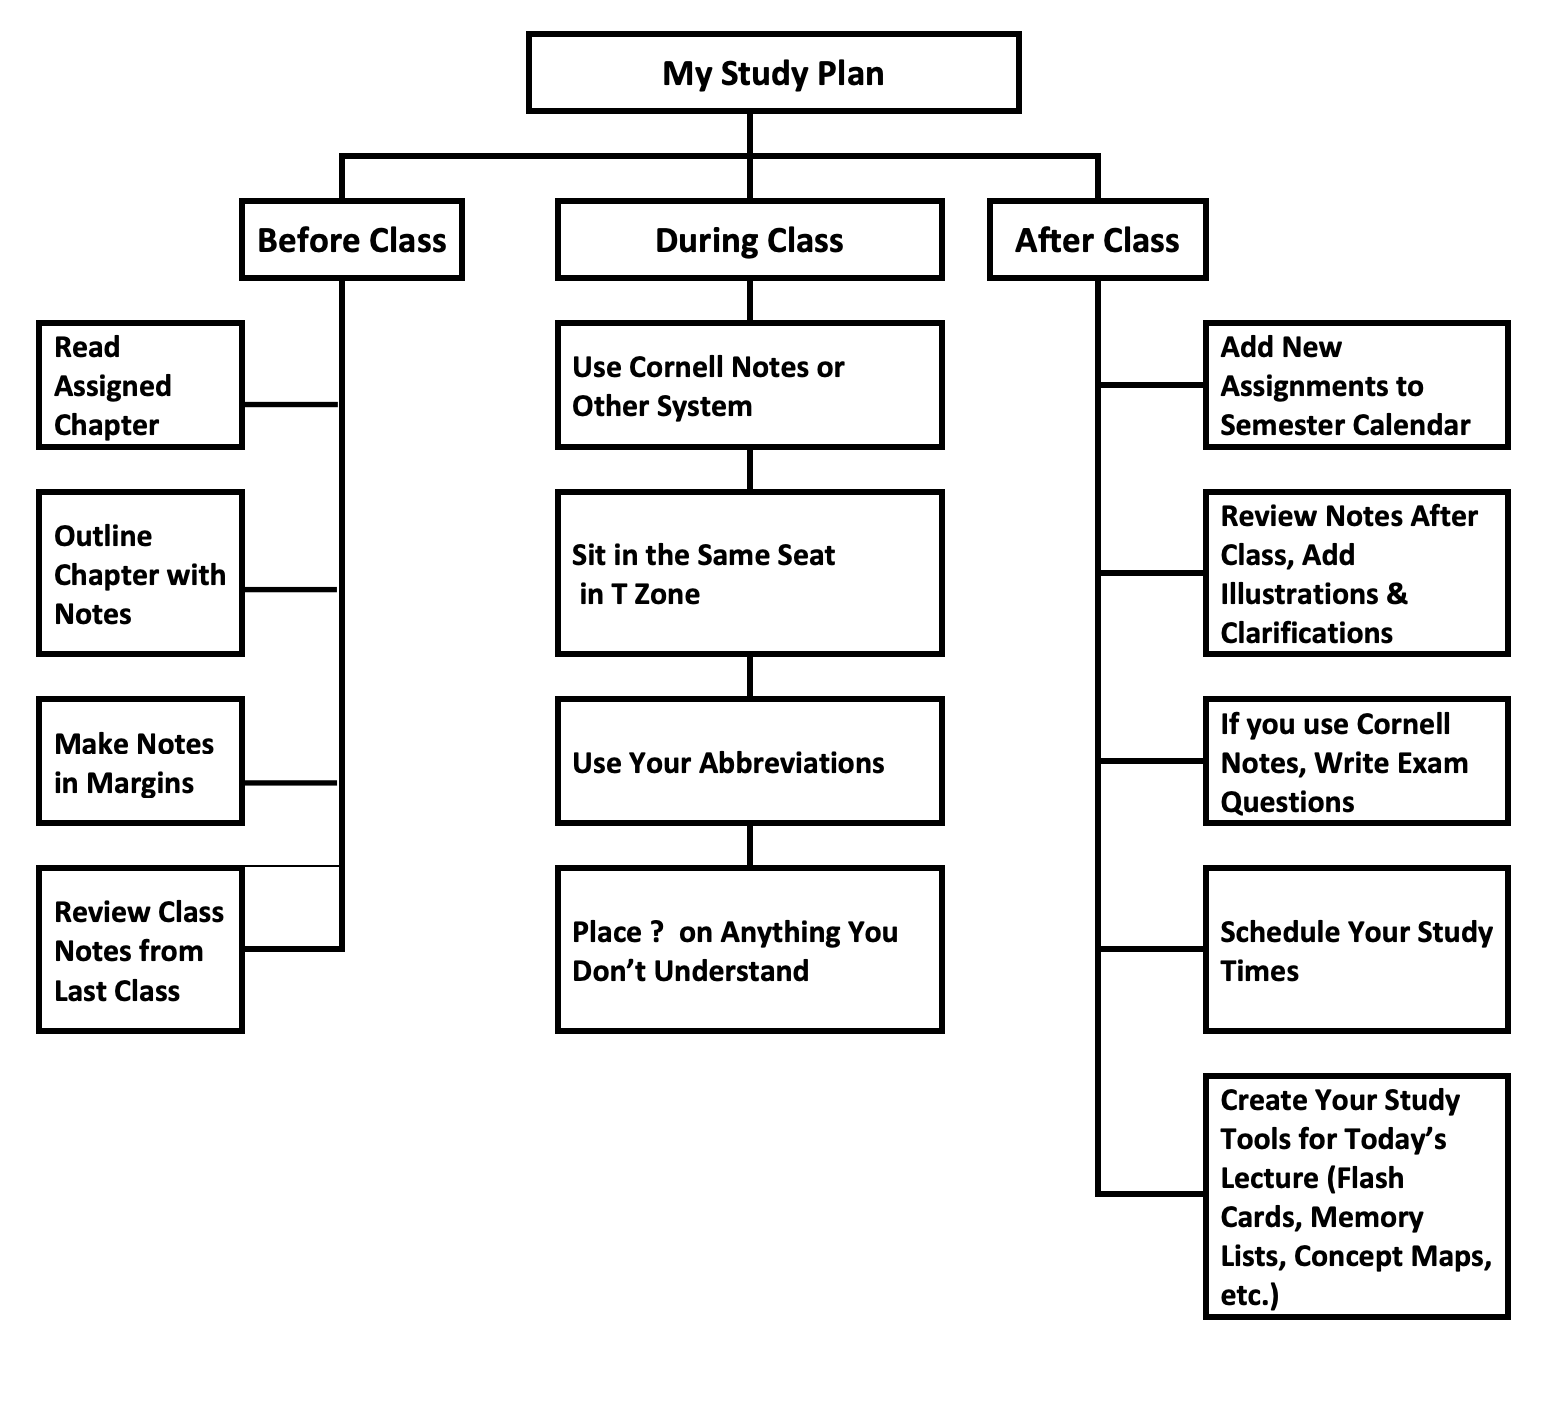
The Flow Chart Map
The first is a simple flow chart diagram which outlines a study plan for before, during and after class. This could as easily be used to diagram the phyllum of a species for a biology class or the chemical reactions between families of chemicals for a chemistry class.
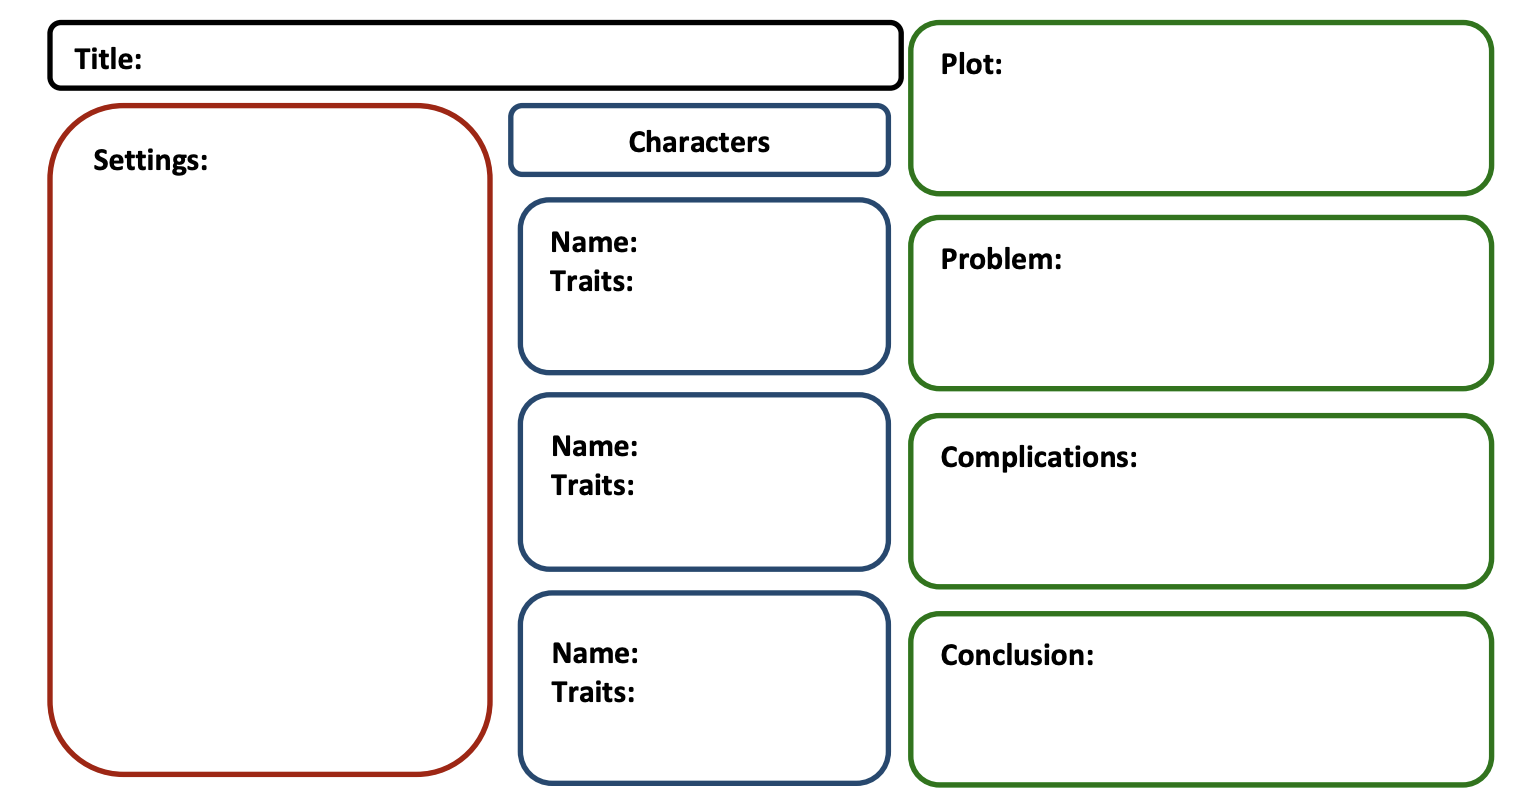
The Story Map
The story (or book) map can help you understand, analyze, and remember the details of a complex piece of literature, play or movie.
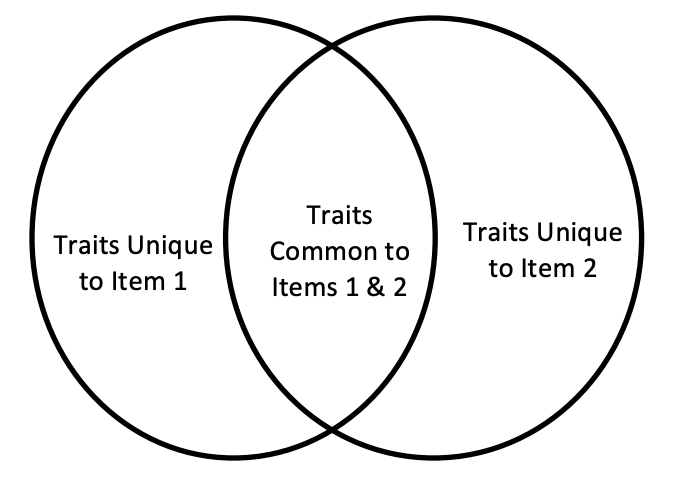
Venn Diagram
The venn diagram allows you to graphically compare and contrast two things (people, places, events, ideas, concepts, etc.). Your information should be arranged in the two intersecting circles with those characteristics unique to each thing being compared written in those parts that do not intersect and those characteristics shared by both concepts written in the intersecting part of the circles. This map will clearly display the commonalities and the differences between the two concepts or items being compared.
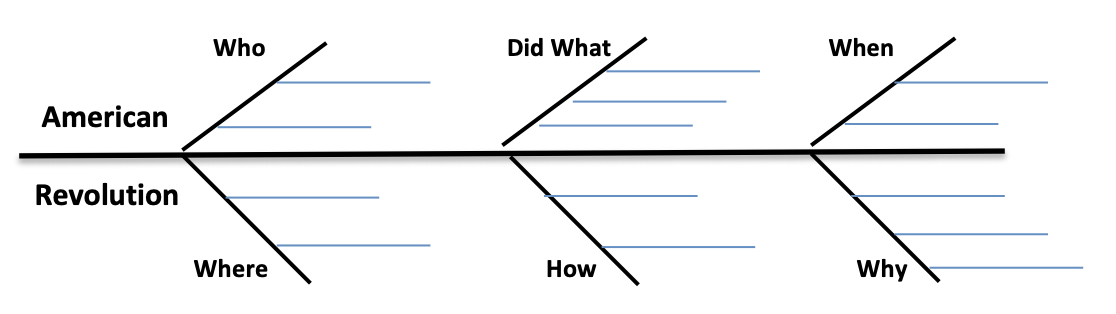
The Fishbone Diagram
The fishbone diagram can be used to help you learn integrated information in a way that enhances your ability to answer essay questions. It is a good tool to show cause and effect interactions of a complex event or phenomenon. The spine of the fishbone represents the Primary Idea or Activity being represented. Each of the primary fins represents a contributing factor to the main idea. Supporting information is attached to each fin as needed. While this illustration would be good for a history course, fishbone diagrams are used regularly to analyze process control in business and industry as well.